API
Price legend collapse
API
Add to layout file , block “collapselegend”
|
1 2 3 4 5 6 7 8 9 10 11 12 13 14 15 16 17 18 19 20 21 22 23 24 25 26 27 28 29 30 31 |
............... }, legend: { view: true, height: 'inherit', top: 12, left: 23, right: 110, padding: [0, 0, 0, 0], more:true }, collapselegend: { view: true, height: 15, top: 12, left: 5, width: 15, collapseopen:false, title_1:"+", title_2:"-" }, watermark: { view: true, bottom: 30, left: 40, width:200, height:40, padding: [0, 0, 0, 0] }, .............. |
Where
collapseopen:false|true
Status for start show legend or hide
title_1and title_2
Symbol for show / hide legend
Mobile support
API
For best performance on mobile system , chart supports enabling off/on the following modules:
Off|On
Add to “ProChart_InitLayout” event
|
1 2 3 4 5 6 |
objChartMain1.apiinit.guipart.enabled.menu = false|true; objChartMain1.apiinit.guipart.enabled.toolbar = false|true; objChartMain1.apiinit.guipart.enabled.header = false|true; objChartMain1.apiinit.guipart.enabled.zoom = false|true; objChartMain1.apiinit.guipart.enabled.signals = false|true; objChartMain1.apiinit.guipart.enabled.plugs = false|true; |
Switch Expiration Mode
API
Expiry Mode
The “Expiration Mode” enables the Chart to stop data updates, based on a specified “expire” date. Any new data afterwards will not update the Chart.
In regular mode the Chart shifts the data to the left. In “Expiration Mode” the Chart fills from left to right, showing all the data including the future dates area.
The following API enables switching this mode ON or OFF on the fly.
StopExpiration
Disable expiration mode and reset buffers accordingly.
|
1 2 3 4 |
objChartMain1.chart.StopExpiration(); objChartMain1.chart.SetNumberOfBars(1000); //Reduce buffer size objChartMain1.chart.SetNumVisibleItems(90); //How many candle to show (default zoom in) objChartMain1.chart.SetNumFuturesBars(1,1); //Reduce the number of future bars (iNumOfFutureBars, iNumVisibleFutureBars) |
UpdateExpirationField
Update the expiration date and enable expiration mode if not already enabled.
|
1 2 3 |
objChartMain1.chart.UpdateExpirationField("date","2017-01-01 10:00:00"); objChartMain1.chart.SetNumberOfBars(300000); //Increase buffer size objChartMain1.chart.SetNumVisibleItems(30000); //How many candle to show (default zoom in) |
API-Events
API
Events demo
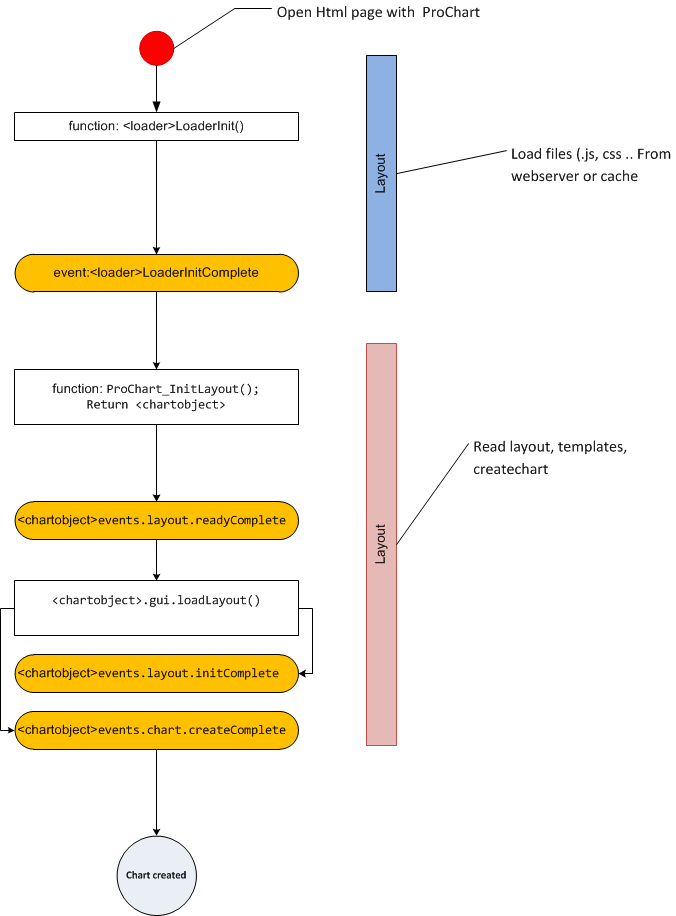
Loader
LoaderInitComplete
Complete load the Chart’s library files
|
1 |
[loadeobject].LoaderInitComplete = function(){}; |
Chart (Layout)
readyComplete
Complete read all files for the layout
|
1 |
[chartobject].events.layout.readyComplete = function(){} |
initComplete
Complete init all properties and objects for the layout
|
1 |
[chartobject].events.layout.initComplete = function(){} |
onFullPage
Event when the chart opens to full screen or not
|
1 |
[chartobject].events.layout.onFullPage = function(true|false){} |
onPreloadStart
Event when the “preload” (wait animation) start
|
1 |
[chartobject].events.layout.onPreloadStart = function(parent, width, height){} |
onPreloadFinished
Event when the “preload” (wait animation) finished
|
1 |
[chartobject].events.layout.onPreloadFinished = function(parent){} |
Chart object
createComplete
The chart object is successfully created and ready to work
|
1 |
[chartobject].events.chart.createComplete = function(){} |
onChangeMajorsFavorites
Change majors favorites in the chart
|
1 |
[chartobject].events.chart.onChangeMajorsFavorites = function(returnFavprites, SymbolID, status){} |
onChangeComparesFavorites
Change compares favorites in the chart
|
1 |
[chartobject].events.chart.onChangeComparesFavorites = function(returnFavprites, SymbolID, status){} |
onChangeIndicatorsFavorites
Change indicators favorites in the chart
|
1 |
[chartobject].events.chart.onChangeIndicatorsFavorites = function(returnFavprites, SymbolID, status){} |
onChangeSymbol
Change current symbol in the chart
|
1 |
[chartobject].events.chart.onChangeSymbol = function(parentid, SymbolObject){} |
onChangeTimeframe
Change current timeframe in the chart
|
1 |
[chartobject].events.chart.onChangeTimeframe = function(parentid, TimeFrameID){} |
onTimeZoneChanged
Change current time zone in the chart
|
1 |
[chartobject].events.chart.onTimeZoneChanged = function(parentid, LongSecondsOffset){} |
onPriceTypeChange
Change current price type in the chart
|
1 |
[chartobject].events.chart.onPriceTypeChange = function(parentid, PriceType){} |
onLastUpdateChange
The event occurs when the data is updated
|
1 |
[chartobject].events.chart.onLastUpdateChange = function(parentid, StringLastUpdateDate){} |
Chart (Shape)
onStartDrawing
The event happens when we start drawing a shape
|
1 |
[chartobject].events.shape.onStartDrawing = function(){} |
onStopDrawing
The event occurs when we have finished drawing a shape
|
1 |
[chartobject].events.shape.onStartDrawing = function(){} |
onDeleted
The event occurs when we delete a shape
|
1 |
[chartobject].events.shape.onDeleted = function(){} |
onSelectChange
An event occurs when we select another shape
|
1 |
[chartobject].events.shape.onSelectChange = function(){} |
onEndDrag
The event occurs when we finish moving the shape
|
1 |
[chartobject].events.shape.onSelectChange = function(){} |
onEndSize
The event occurs when we finish moving the resizing of the shape
|
1 |
[chartobject].events.shape.onEndSize = function(){} |
onDeleted
The event occurs when we have already deleted the figure
|
1 |
[chartobject].events.shape.onDeleted = function(){} |
Chart (Study|Indicators)
onUpdated
The event occurs when we change the parameters in the indicator
|
1 |
[chartobject].events.study.onUpdated = function(){} |
onAdded
The event occurs when the indicator is added
|
1 |
[chartobject].events.study.onAdded = function(){} |
onDeleted
The event occurs when we delete the indicator
|
1 |
[chartobject].events.study.onDeleted = function(){} |
Loclization
onChange
The event occurs when the language changes
|
1 |
[chartobject].events.localization.onChange = function(parentid, LanguageID, rtl|ltr){} |
Change Size
API
|
1 2 3 4 5 |
// arg1 - width // arg2 - height function changeSize(arg1,arg2) { objChartMain1.api.layout.set('width||height', arg1 + "||" + arg2); } |
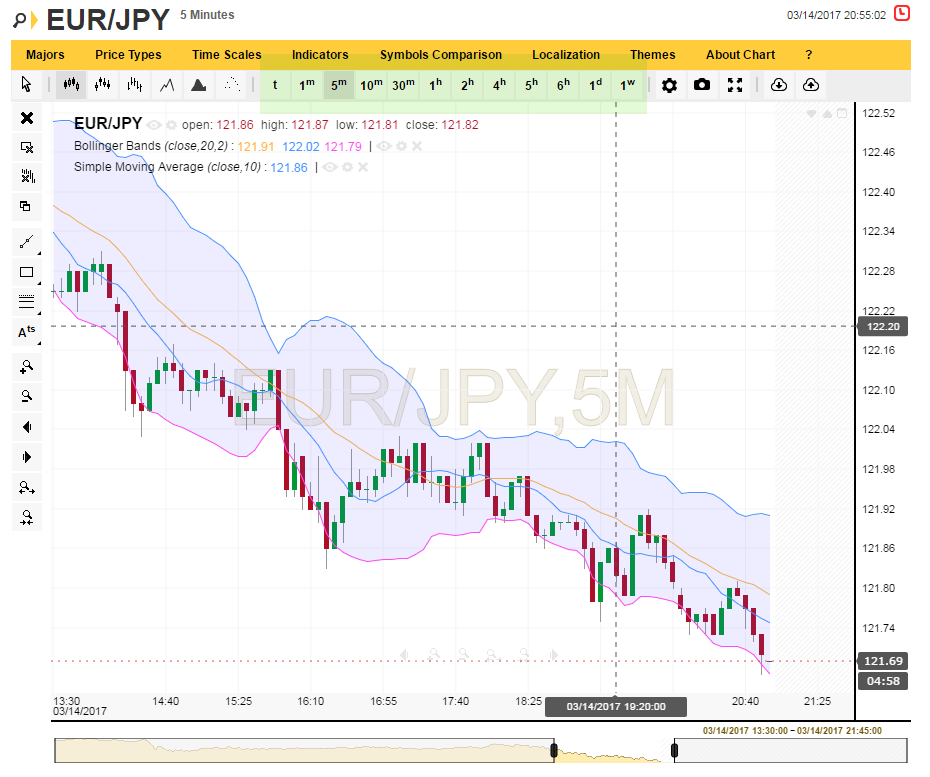
Custom timeframes
API, Features
How-to create custom timeframe?
Toolbar
1st step
Add to layout file ( until version 5.3.1 ) property “timeframeview”
|
1 2 3 4 5 6 |
var objCurrentLayout = { layout: null, ..... ..... timeframeview:"text" // icon/text }; |
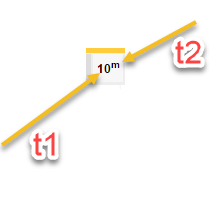
2 step:
Change time scale properties in html
|
1 2 3 4 5 6 7 8 9 10 |
// time scale objChartMain1.apiinit.timeframes = [ { 'n': 'tick', 'id': '1T', 'f': 1, 't1': 't', 't2': '' }, { 'n': '1 Minute', 'id': '1M', 'f': 1, 't1': '1', 't2': 'm' }, { 'n': '5 Minutes', 'id': '5M', 'f': 1, 't1': '5', 't2': 'm' }, { 'n': '10 Minutes', 'id': '10M', 'f': 1, 't1': '10', 't2': 'm' }, { 'n': '15 Minutes', 'id': '15M', 'f': 0, 't1': '15', 't2': 'm' }, ... { 'n': '1 Year', 'id': '1Y', 'f': 0, 't1': '1', 't2': 'y' } ]; |
|
1 |
{ 'n': '10 Minutes', 'id': '10M', 'f': 1, 't1': '10', 't2': 'm' } |
Menu
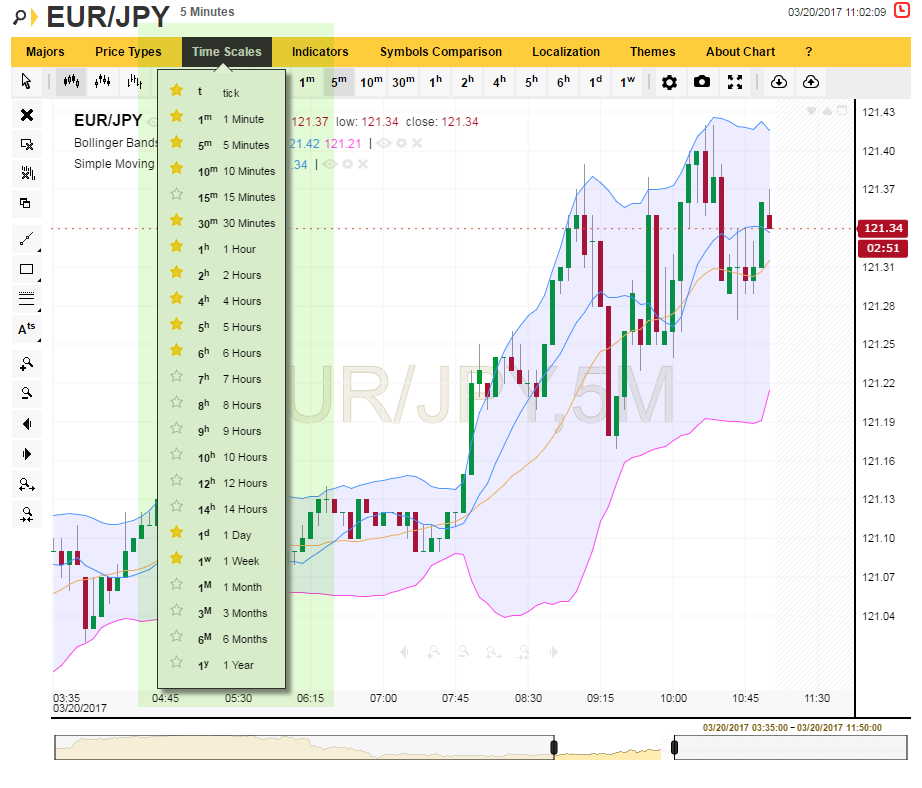
Layout file , object menu
|
1 2 3 4 5 6 7 8 9 10 11 12 13 14 15 16 17 18 19 20 |
.... } { type: "menu-item-group", id: "timeframe", caption: "Time scales", localize: "menu.timescale.title", group: { possition: "bottom", alignv: "auto", alignh: "auto", columns: 1, css: "" }, items: [ { type: 'menu-group-timeframe', id: "group-timeframe", favorites: true, icons: true } ] }, { .... |
Drop-down toolbar
Layout file , object toolbar
|
1 2 3 4 5 6 7 8 9 10 11 12 13 14 15 16 17 18 19 20 21 22 23 24 25 26 27 28 29 |
.... }, { type: "button-group", id: "group-timescale", localize: "menu.timescale.1T", icon: "tick", caption: "tick", title1:"", title2:"", group: { type: "tooltip", possition: "bottom", alignv: "auto", alignh: "auto", columns: 3, css: "", closebyclick: true, changegroupicon: true, grouptype: "timescale", viewtype:"text" }, items: [ { type: "button-group-timeframe", id: "timeframe" } ] }, .... |
Load and Save Technical Analysis Definitions
API, How-to
The following API calls offers saving and loading of the entire Chart
state, including price-type, time-scale, selected symbol, drawings and
indicators.
Get Data From The Chart (For Saving):
|
1 2 3 |
//Prototype: objJSONObject = GetTAObject(blnSymbol, blnTimeScale, blnDrawing, blnIndicators, blnPriceType); |
| Name | Type | Description |
| blnSymbol | Boolean | True to include current symbol id and name. |
| blnTimeScale | Boolean | True to include current time-scale. |
| blnDrawing | Boolean | True to include all drawings. |
| blnIndicators | Boolean | True to include all indicators. |
| blnPriceType | Boolean | True to include the current price-type. |
Return Value
The return value is the definition JSON object.
Loading Data Back Into The Chart:
|
1 2 |
//Prototype: SetTAObject(objJSONObject); |
| Name | Type | Description |
| objJSONObject | JavaScript object | The Technical Analysis data |
Return Value
There is no returned value
Examples
Example:
|
1 2 3 4 5 6 7 8 9 10 11 12 13 14 15 16 17 18 19 20 21 22 23 24 |
function SaveUserDrawings(){ SaveToCookie("UserDraw1", objChartMain1.chart.GetTAObject(true, true,true,true,true)); } function OpenUserDrawings(){ objChartMain1.chart.SetTAObject(LoadFromCookie("UserDraw1")); } function SaveToCookie(name, value) { var cookie = [name, '=', JSON.stringify(value), '; domain=.', window.location.host.toString(), '; path=/;'].join(''); document.cookie = cookie; } function LoadFromCookie(name) { var result = document.cookie.match(new RegExp(name + '=([^;]+)')); result && (result = JSON.parse(result[1])); return result; } function DeleteCookie(name) { document.cookie = [name, '=; expires=Thu, 01-Jan-1970 00:00:01 GMT; path=/; domain=.', window.location.host.toString()].join(''); } |
Example2:
|
1 2 3 4 5 6 7 8 9 10 |
var objTAJson = null; function SaveUserDrawings(){ objTAJson = objChartMain1.chart.GetTAObject(true, true,true,true,true); } function OpenUserDrawings(){ if (objTAJson != null) objChartMain1.chart.SetTAObject(objTAJson); } |
Callbacks For Timing Load/Save Of Data
In addition, you can add callbacks to the chart in order to know when it is safe to load or save this data.
The first parameter is for Future-Use (please ignore it). You can use the symbol and timescale as key for saving.
|
1 2 3 4 5 6 7 8 9 |
//Callback for saving objChartMain1.chart.UI.funcOnCanSaveTA = function (objParameter, strSymbolID, strTimeScale){ ...Do you saving } //Callback for Loading objChartMain1.chart.UI.OnCanLoadTA= function (objParameter, strSymbolID, strTimeScale){ ...Do you saving } |