Features

Custom Fibonacci and Gann Levels

Features

Version 6.7.5 includes a new feature to customize the Fibonacci and Gann levels.
Customization is done during load time, where the first symbol and timescale being set, inside the
objChartMain1.events.layout.initComplete callback function.

Each definition contains an array of levels and boolean values for visible (true) / invisible (false) per each level.
Please note that the number of levels (items in each array) should not change.

Version 6.5.X Highlights

Features, Versions
  • Sliding in mobile up/down with a single finger for page and two fingers for chart slide. The page slide didn’t work correctly.
  • Ability to add attributes to a menu.
  • Support for dynamic tooltips for buttons.
  • Big-values format. Price and each indicator support a new “BigValueFormat” property with a configuration for rounding big numbers. e.g. 1.23B, 4.56M, 1.16K.
  • Chart supports creating a trade line (long, short, SL, TP, etc…) by enabling click capture and a callback for the customer logic, via CaptureNextClick API.
  • Indicators level values (e.g. 30, 70 at RSI) are being format with the same precision as the rest of the values.
  • None combined mode: Version 6.5 and newer releases will only include the combined files as there is no need any more for separate modules.
  • New init flag “TwoFingersPriceSlide” and API “EnableTwoFingersPriceSlide”. When set to true, one finger up/down swipe on chart will slide the page and two fingers to move the price / indicator. The default is false with one finger to move price / indicator

Version 6.4.X Highlights

Features, Versions
  • Trend lines now support double-click and long-tap callbacks to allow editing rate line via dedicated customer screens and logic.
  • Update – Add callback to support customer to override mobile vs. none mobile decisions.
  • Loader is now based on require.js and works faster.
  • Cache now works more efficient as most of files now load from disk instead of network after first time.
  • Station mode, where multiple charts reuse the same infrastructure and prevents double loading of shared files. It reduces bandwidth and loads the charts much faster.
  • Ability to customize package based on customer requirements (e.g. specific indicators, drawings, price types etc…) to reduce core size.

Version 6.3.X Highlights

Features, Versions
  • ChartCore size reduced by 17%.
  • New Shapes API
  • New price axis property “smartRound”, which makes better display and formating of price axis labels.
  • New Callback for zoom “OnZoomChangeCallback” to enable overwriting zoom. It also enables customer to save and restore zoom per required states, like per timescale. So user will have persistence zoom on each period based on his last selection.
  • User can now save updated indicator settings as default.
  • Html pattern files combined to reduce bandwidth.
  • Toolbar buttons support dropdown with Text and Labels.
  • Menu supports scrollbar when menu is longer than height.
  • User can now move Horizontal Lines (e.g. Stop Loss / Take Profit) when supplying “movewithmouse” and “callback” properties to an HLine.

Version 6.2.X – Highlights

Features, Versions
  • Create any indicator on any panel and move indicators between panels.
  • Move volume between price panel and a separate panel.
    Infrastructure to display events, news, split, dividend and patterns on Chart with new Signals – Interface.
  • Optimization and Cleanup.
  • Batch properties update for Shapes.
  • Out of range markers to show price lines rendered outside price-range viewport.
  • Support long EPOCH (Unix DateTime) dates.
  • API SetZoomOnDates to zoom on a specific date range with padding.
  • Several Volume based indicators (CMF and OBV).
  • Callbacks to load / save Technical analysis:
    events.chart.onCanSaveTA and events.chart.onCanLoadTA
  • Panel title can optionally have a collapse / expand button to show/hide additional indicators on the panel.
  • Time-frame display can optionally be a time-scale select drop-box

Price as Area with Gradient Fill

Features

Starting from version 5.3.x it is possible to enable gradient fill for Area price-type.
It requires editing the relevant “chart.css.json.js for” file,  and adding a “fill2” and “fillOpacity” attributes with the required color and opacity.

You can locate the entry via price->area.

Solid fill:


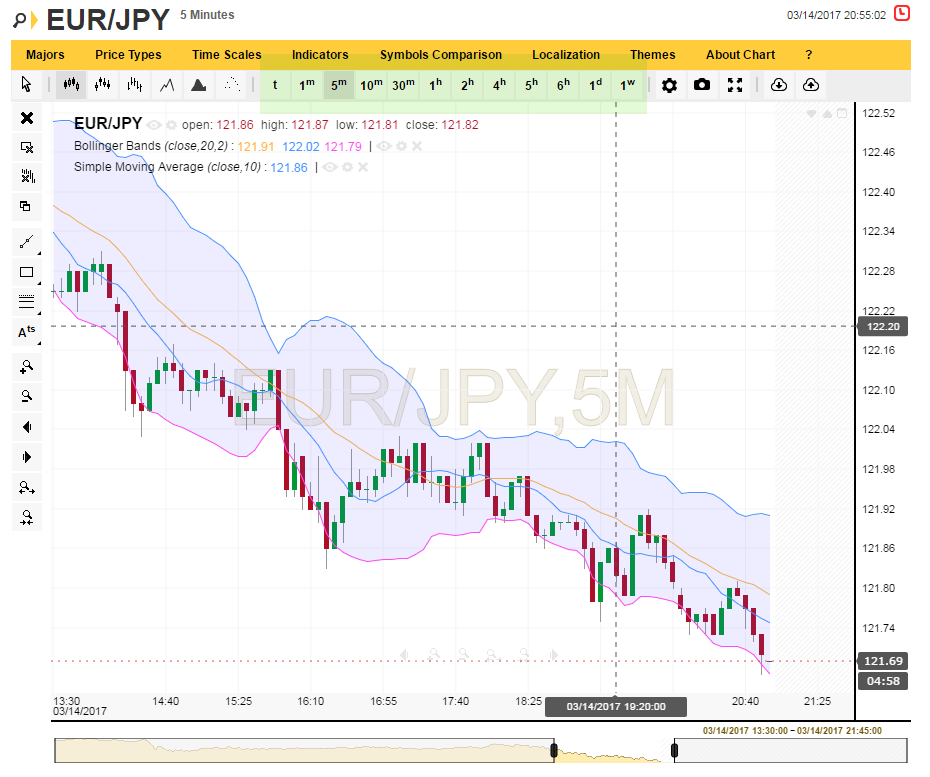
Gradient fill version 5.3.x:

Gradient fill version 5.4.x:

stroke is the line color.
fill and fill2 are the gradient’s starting and ending colors.
fillOpacity is the gradient opacity.
fillOpacity2 is the gradient opacity for fill 2 (supported from version 5.4.0 and above).


Version 5.3.3

Features, Versions

Updates:

  • Added more events callback for Shape and Indicators to notify on adding, modifying, dragging and resizing.
    Can be used to collect BI or persist user state after each change.

Version 5.3.2

Features, Versions

New Features:

  • Responsive Mode.
    A new property objChartMain3.apiinit.parentRelativeObjectID enables referencing a relative parent for automatic resizing.
    This feature is mainly for responsive web platforms, which embed the Chart inside an internal container.
    The Chart will resize to accommodate new real-estate size among the rest of the page containers.


  • Light Mode.
    This feature offers a solution for reducing loading file size signature, by marking the none required modules.


Custom timeframes

API, Features

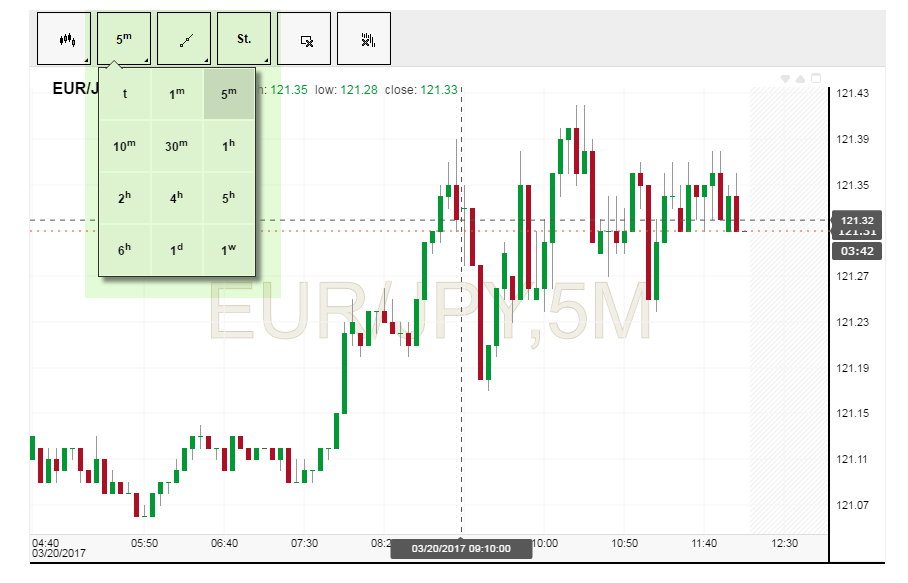
How-to create custom timeframe?

Toolbar

1st step

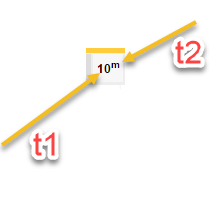
Add to layout file ( until version 5.3.1 ) property “timeframeview”

2 step:
Change time scale properties in html

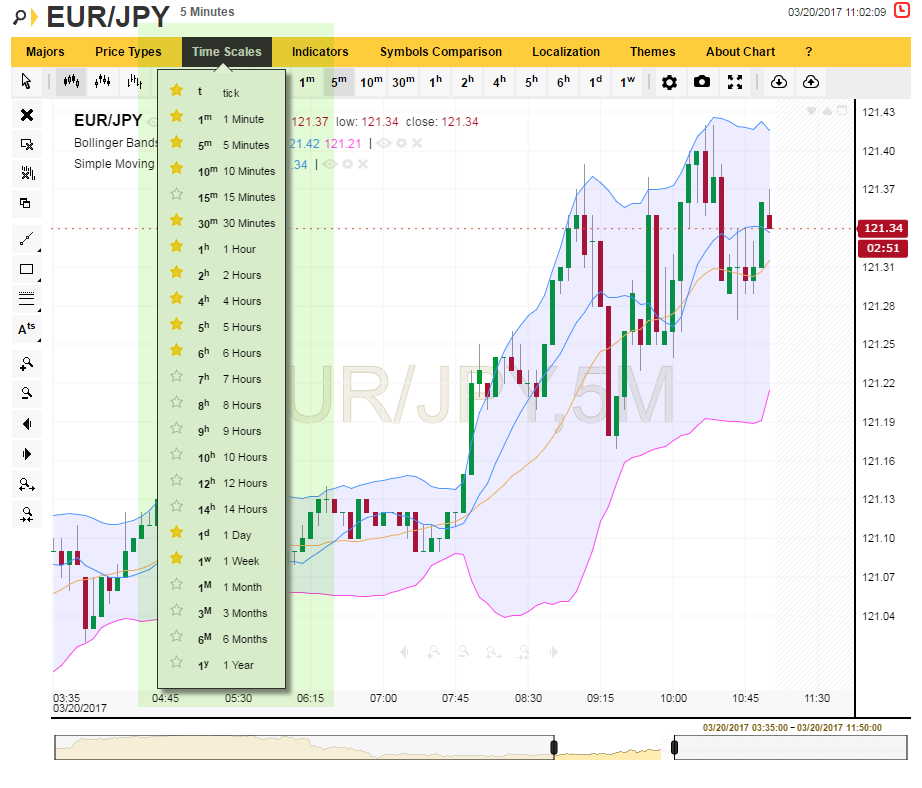
Menu

Layout file , object menu

Drop-down toolbar

Layout file , object toolbar